How to Create Pie Chart Using AngularJS and Highcharts
If you seek tutorial about how to create pie chart by using PHP and MySQL database, you can find our previous tutorial :"Create Pie Chart using data from MySQ and MySQL".
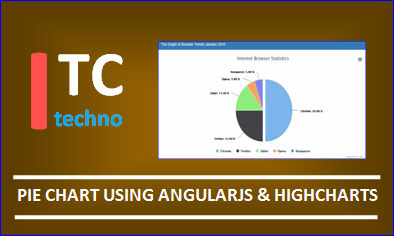
The final result of this tutorial is shown in Figure 1 below:
As you can see the figure above, the pie chart shows the percentage of the most used browser in 2015, where the data is described by the following table:
| Browser Name | Total |
|---|---|
| Chrome | 50 |
| Firefox | 25 |
| Safari | 15 |
| Opera | 5 |
| Konqueror | 5 |
From the table above, if we count the number of browser from Chrome to Konqueror, then it will get the total is 100.
The percentage of Chrome = 50 100 x 100% = 50%
The percentage of Firefox = 25 100 x 100% = 25%
The percentage of Safari = 15 100 x 100% = 15%
The percentage of Opera = 5 100 x 100% = 5%
The percentage of Konqueror = 5 100 x 100% = 5%
Step by Step Guide: Create Pie Chart Using AngularJS
1. Create file angularpiechart.htmlIn this file, we define the module name for the directive ng-app, which is chartApp. Then we also we define the controller with the name ng-controller = "myController". Other program codes are the interface for the navigation bar (using bootstrap). Here is the program code in the file angularpiechart.html:
<!DOCTYPE html>
<html ng-app="chartApp">
<head>
 <meta charset="utf-8">
 <meta name="viewport" content="width=device-width, initial-scale=1.0">
 <meta name="author" content="ilmu-detil.blogspot.com">
 <title>AngularJS Graph Using Highcharts </title>
 <link rel="stylesheet" href="assets/css/bootstrap.min.css">
 <link rel="stylesheet" href="assets/css/ilmudetil.css">
 <script  src="assets/js/jquery-1.11.3.min.js"></script>
 <script src="assets/js/highcharts.src.js"></script>
 <script src="assets/js//angular.js"></script>
 <script src="assets/js/exporting.js"></script>

</head>
<body >
<nav class="navbar navbar-default navbar-fixed-top">
 <div class="container">
  <div class="navbar-header">
   <button type="button" class="navbar-toggle" data-toggle="collapse" data-target=".navbar-collapse">
    <span class="icon-bar"></span><span class="icon-bar"></span><span class="icon-bar"></span>
   </button>
   <a class="navbar-brand" href="index.html">
   Pusat Ilmu Secara Detil</a>
  </div>
  <div class="navbar-collapse collapse">
   <ul class="nav navbar-nav navbar-left">
    <li class="clr1 active"><a href="index.html">Home</a></li>
    <li class="clr2"><a href="">Programming</a></li>
    <li class="clr3"><a href="">English</a></li>
   </ul>
  </div>
 </div>
</nav>
</br></br></br></br>
<div class="container" style="margin-top:20px" ng-controller="myController">
 <div class="col-md-10">
  <div class="panel panel-primary">
   <div class="panel-heading">The Graph of Browser Trends January 2015</div>
    <div class="panel-body">
     <div id ="mygraph"></div>
   </div>
  </div>
 </div>
</div>
<script src = "chart.js"> </script>
</body>
</html>
2. Create chart.js file
In this file, we specify the graph type by setting type: 'pie' to tell that the graph is a pie chart.
angular.module('chartApp', [])
.controller('myController', function ($scope) {
 Highcharts.chart('mygraph', {

    chart: {
    plotBackgroundColor: null,
    plotBorderWidth: null,
    plotShadow: false,
    type: 'pie'
   },
  title: {
    text: 'Internet Browser Statistics '
      },
   plotOptions: {
   pie: {
    allowPointSelect: true,
    cursor: 'pointer',
    dataLabels: {
     enabled: true,
     color: '#000000',
     connectorColor: 'green',
     formatter: function()
     {
      return '<b>' + this.point.name + '</b>: ' + Highcharts.numberFormat(this.percentage, 2) +' % ';
     }
    },
    showInLegend: true
   }
  },

  series: [{
     name: 'Brands',
     data: [{
      name: 'Chrome',
      y: 50,
      sliced: true,
      selected: true
     }, {
      name: 'Firefox',
      y: 25

     }, {
      name: 'Safari',
      y: 15
     }, {
      name: 'Opera',
      y: 5
     },  {
      name: 'Konqueror',
      y: 5
     }]
    }]
 });
});
Notice the following piece of code:
formatter: function()
{
 return '<b>' + this.point.name + '</b>: ' + Highcharts.numberFormat(this.percentage, 2) +' % ';
}
The program code will display the percentage in the form of two decimal point. If the result is a positive integer, example you wish 50% instead of 50.00%. You just change the code to be :
Highcharts.numberFormat(this.percentage, 0)